From Watts to Weights
Closing the gap between sizing infrastructure-up and sizing model-down — and why holding both ends of that equation is the conversation most AI-cluster customers actually need.
I've been sizing AI factories from the bottom up — power envelope, cooling capacity, rack density.
A modern AI-cluster customer needs the other end of that equation: model parameters, parallelism strategy, GPU count, interconnect topology. The conversation that actually matters is where those two ends collide.
This is the synthesis I've been building — seven diagrams walking the layers of an AI cluster from compute up through fabric and back down through storage and OS. The full chain a customer needs to size, and the seams where infrastructure-up thinking meets model-down thinking.
The two ends of the equation
At Accelsius I sized from infrastructure up. This facility delivers X MW. Our two-phase cooling solution rejects Y kW per rack at Z density. Therefore the customer can deploy N GPUs. The numbers are physical and hard. Power is power. A rack rejects what its CDU can pump and chill, and not a kilowatt more.
I'm now learning to size from the model down. The customer wants to train an X-parameter model. The parallelism math demands a minimum of Y GPUs at this interconnect topology. The training-time target requires Z GPUs. The numbers are arithmetical and equally hard. A 1T-parameter model needs ~512 GPUs minimum, and the math behind that number doesn't care about your facility.
The interesting conversation lives where those two ends collide.
Customer wants a 1T model. Math says 512 GPUs. Facilities team says the data center supports 256. Most SAs at this point say "you need a bigger data center." An SA who can hold both ends of the equation can say:
That's the conversation. Most SAs can do the model arithmetic. Very few can connect it back to chilled-water flow rate.
The full sizing chain looks like this:
- Model requirements → GPU count and interconnect topology
- Cluster architecture → SuperPOD config, fabric, storage tier
- Power envelope → what the facility can deliver
- Cooling envelope → what each rack can reject
Most customer SAs are strong on 1 and 2 and weak on 3 and 4. I'm the inverse — building fluency on 1 and 2 while already living in 3 and 4. The diagrams below are where I've been doing that work.
Inside the GPU — the compute layer
A GPU is a memory-bandwidth machine pretending to be a compute machine.
That framing — borrowed from anyone who's profiled a kernel and watched the Tensor Cores idle waiting for HBM — is the cleanest one-line summary of why all the optimization machinery exists. The chip can multiply faster than the memory can feed it. Almost every modern optimization — quantization, the memory hierarchy, kernel fusion, FlashAttention — exists to keep the compute units fed.
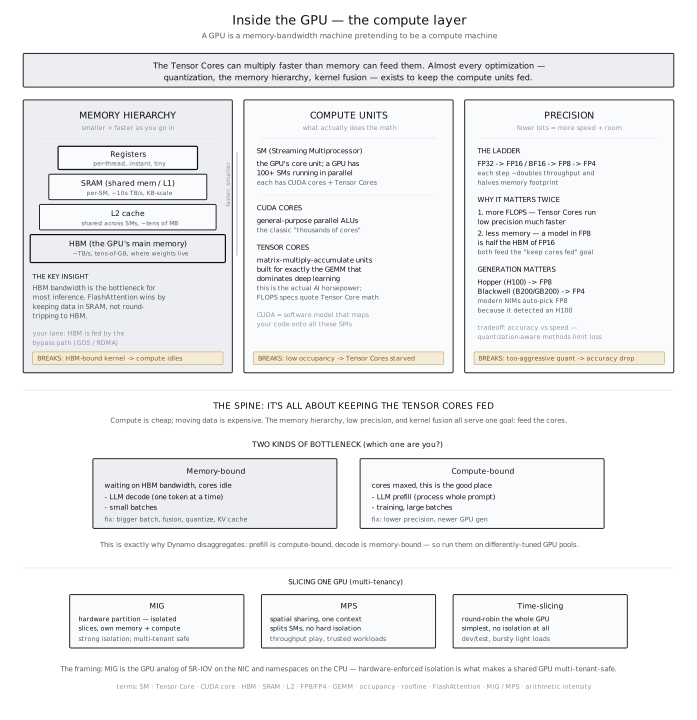
A few things from this layer that show up in customer conversations:
- Memory hierarchy. HBM, L2 cache, shared memory, registers — each tier is an order of magnitude faster and an order of magnitude smaller than the one above. Performance lives in matching tile sizes to the tier where data fits.
- Precision matters. FP16 / BF16 / FP8 aren't just smaller numbers — they're smaller bytes through the same memory bus. Quantization is mostly a bandwidth optimization that happens to use less memory.
- Tensor Cores want specific shapes. GEMMs get the best utilization at specific matrix dimensions. Kernels that don't shape correctly leave performance on the floor.
When a customer says "we're seeing 40% MFU on H100s" the conversation that needs to happen is about where the bottleneck actually lives — and it's almost never compute.
The fabric — scale-up meets scale-out
A GPU is one chip. A frontier model needs thousands. The fabric is how they cooperate.
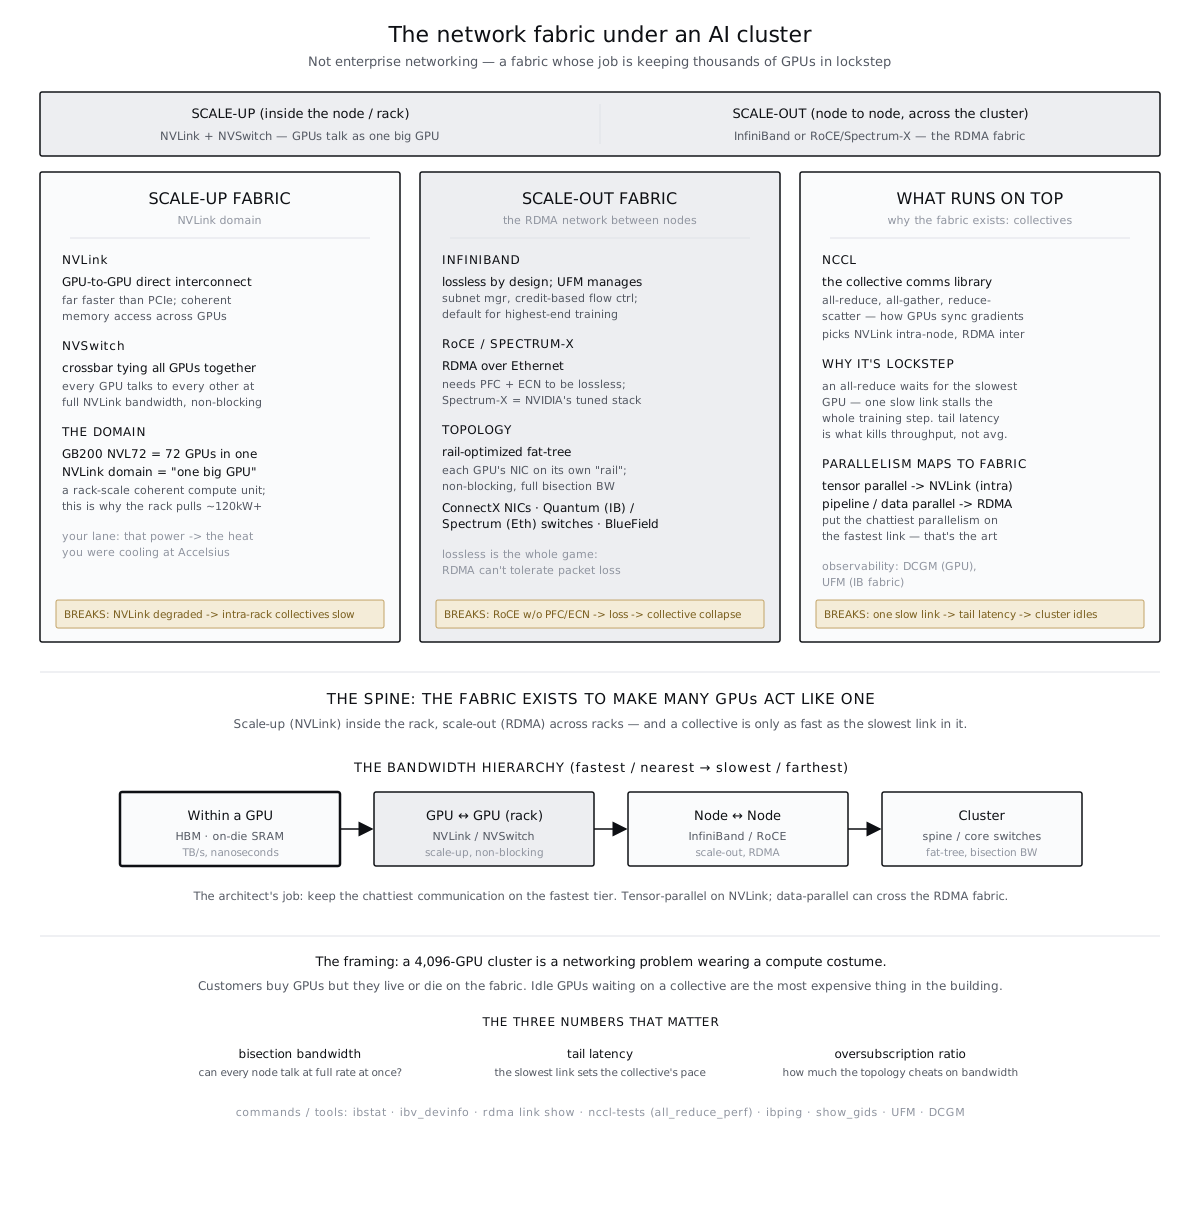
Two scales, two technologies:
- Scale-up — NVLink + NVSwitch. Inside a node (or, in NVL72, a rack), NVLink lets GPUs talk as if they were one big GPU. Tens of TB/s of bandwidth. No software protocol stack overhead. This is where the chattiest communication patterns belong.
- Scale-out — InfiniBand or RoCE. Across nodes, RDMA fabrics deliver bandwidth at hundreds of GB/s with low latency. Software-stack overhead exists but is bounded. Different communication patterns belong here.
The interesting question for an SA isn't "how much bandwidth do you have?" It's "are you putting the right communication pattern on the right tier?"
That maps directly to the next section.
Mapping parallelism to the fabric
This is the diagram I'm proudest of, because it's the synthesis.
A model too big for one GPU is split four ways at once. Each split has a different communication cost — and the layout rule is: match the most bandwidth-hungry split to the highest-bandwidth tier.
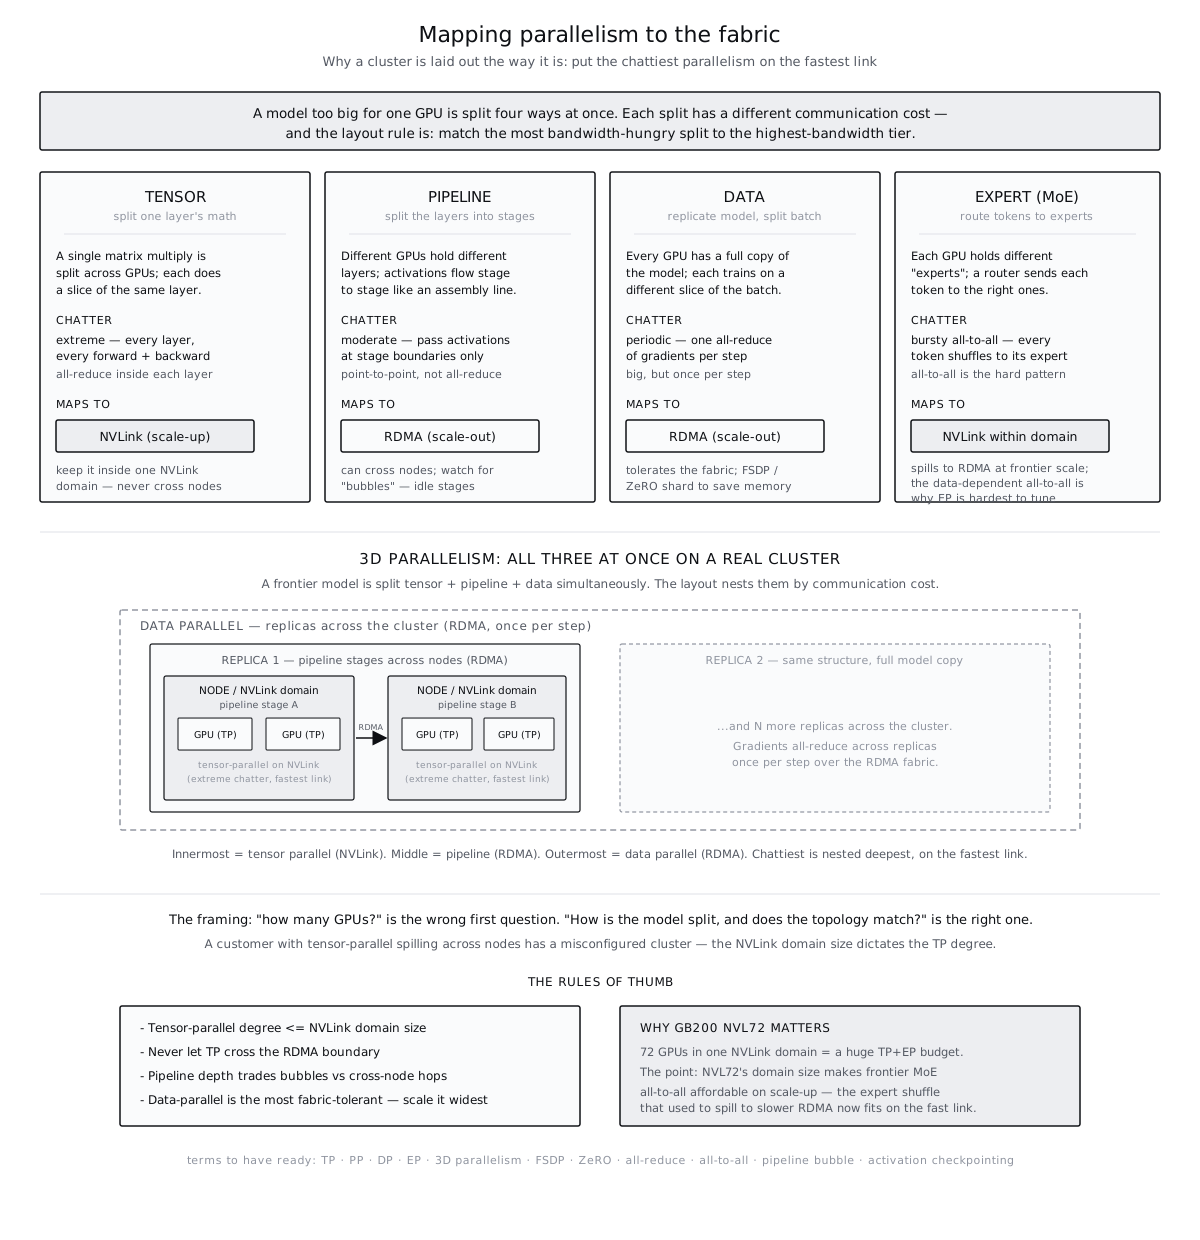
The four patterns:
- Tensor parallel — one layer's math split across GPUs. Extreme chatter, every layer, every forward + backward. Maps to NVLink. Never let it cross nodes.
- Pipeline parallel — layers split into stages. Moderate chatter at stage boundaries only. Maps to RDMA scale-out.
- Data parallel — model replicated, batch split. Periodic chatter (one all-reduce per step). Maps to RDMA — it tolerates fabric latency.
- Expert parallel (MoE) — tokens routed to experts. Bursty all-to-all. Maps to NVLink inside a domain; spills to RDMA at frontier scale.
The 3D-parallelism layout — tensor + pipeline + data simultaneously — nests them by communication cost. Innermost is tensor (NVLink). Middle is pipeline (RDMA). Outermost is data (RDMA). The chattiest pattern is nested deepest, on the fastest link.
This is also why GB200 NVL72 matters. Seventy-two GPUs in one NVLink domain is a much larger TP+EP budget than the previous generation. The data-dependent all-to-all that used to spill to slower RDMA now fits on the fast link. For frontier MoE models, that's the difference between feasible and tractable.
A customer with tensor-parallel spilling across nodes has a misconfigured cluster. The NVLink domain size dictates the TP degree. Some rules of thumb that fall out:
- Tensor-parallel degree ≤ NVLink domain size.
- Never let tensor-parallel cross the RDMA boundary.
- Pipeline depth trades bubbles against cross-node hops.
- Data-parallel is the most fabric-tolerant — scale it widest.
Feeding the cluster — storage
Storage in an AI cluster isn't a capacity problem. It's a bandwidth problem with two very different I/O patterns.
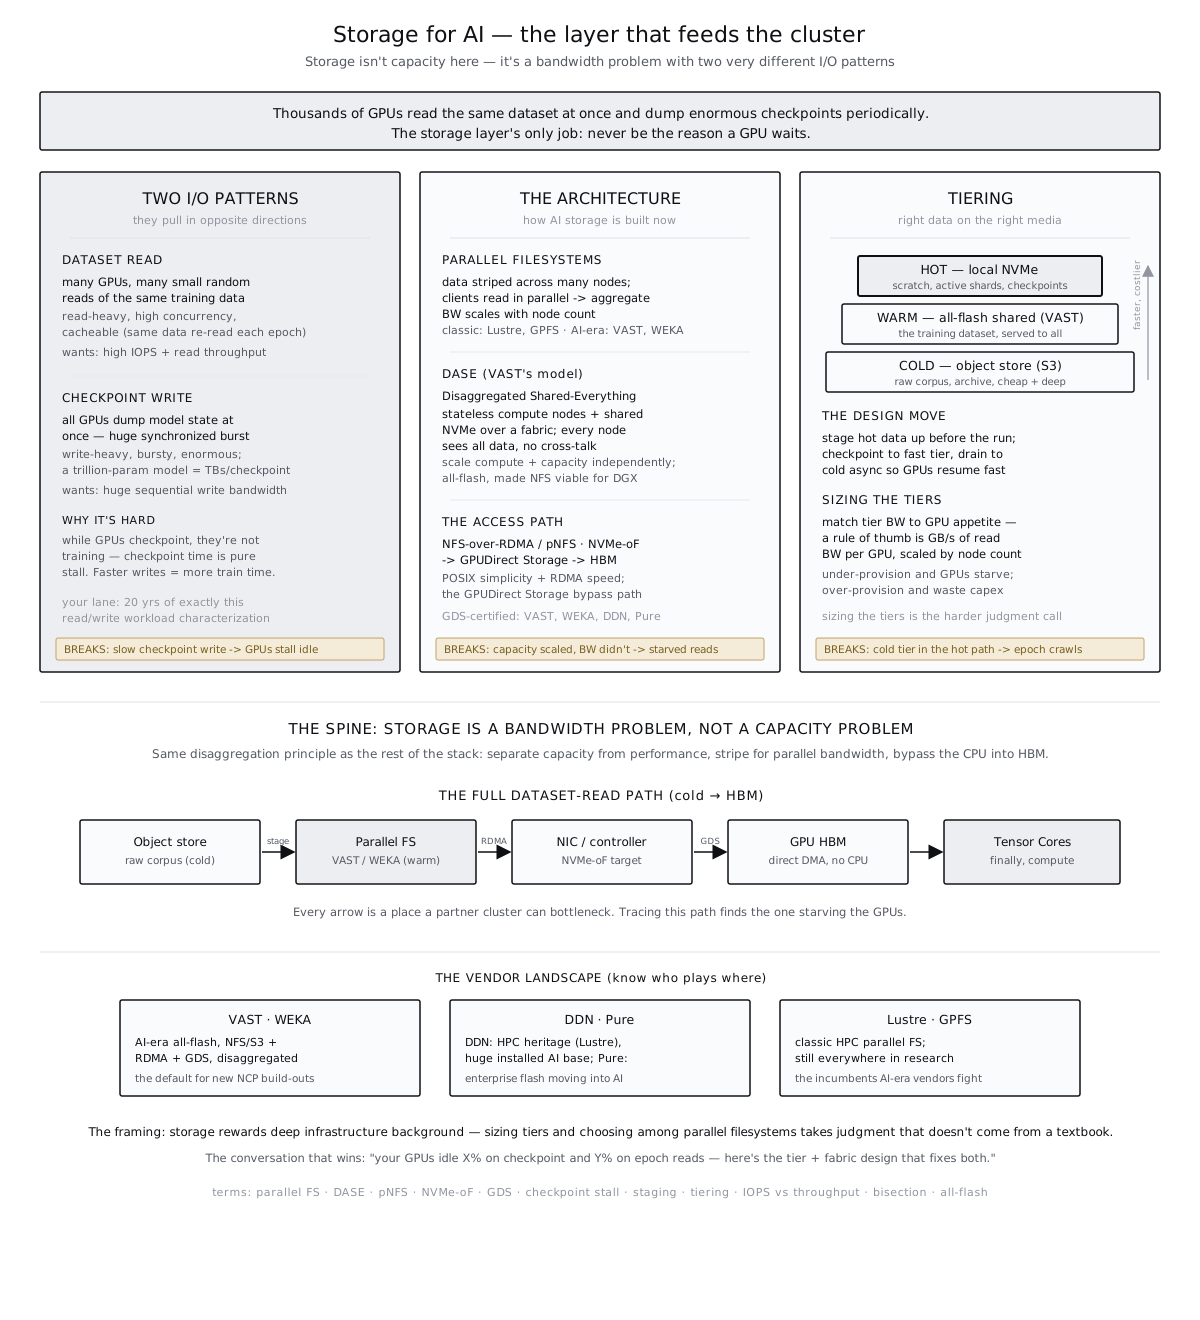
Pattern one — dataset reads. Thousands of GPUs read the same dataset in parallel. Per-GPU access looks broadly sequential; in aggregate it resembles a thundering herd. Sustained throughput at scale matters.
Pattern two — checkpoint writes. Periodically, the entire training state — weights, optimizer state, sometimes activations — gets persisted. The write is enormous and bursty. Time-to-checkpoint affects training time directly.
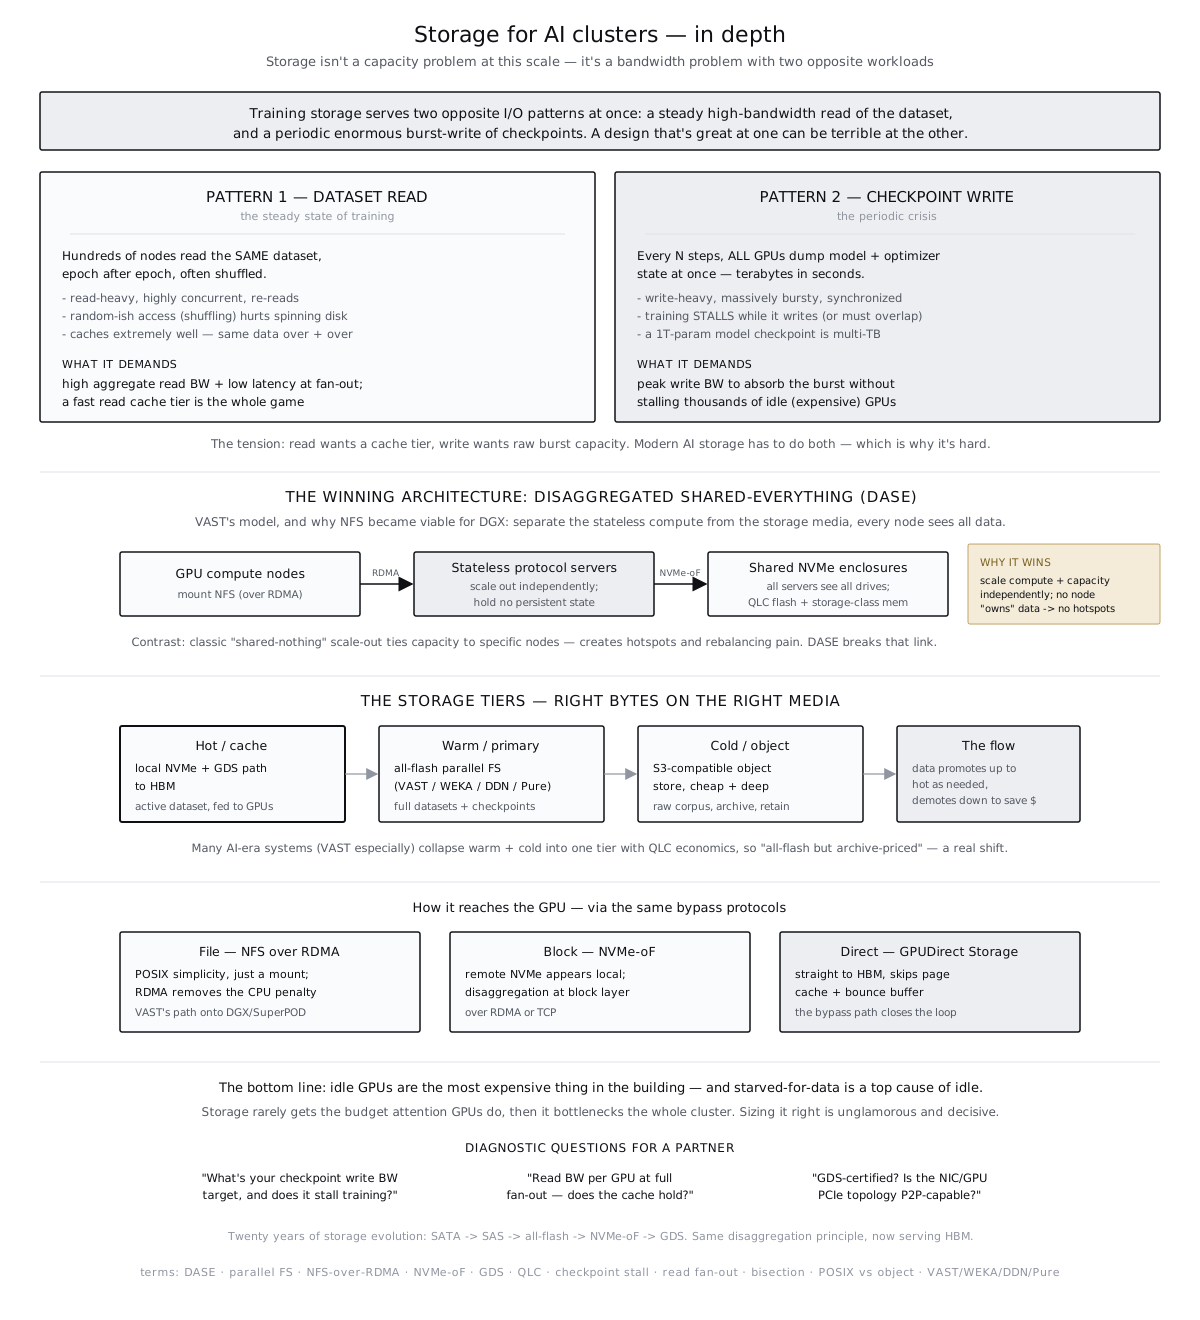
Modern AI-storage solutions (VAST, WekaIO, DDN, Hammerspace) are built around exactly that constraint. Tiered SSD/HDD architectures, parallel filesystems, GPUDirect Storage integration, and very fast metadata layers.
The question for an SA isn't "what's your IOPS?" It's "what's your sustained read bandwidth per GPU on a 1,000-GPU training job, and what's your checkpoint write time at full state?"
The bypass — getting bytes into HBM
Most of the optimization work in modern storage stacks is about removing the CPU from the data path.
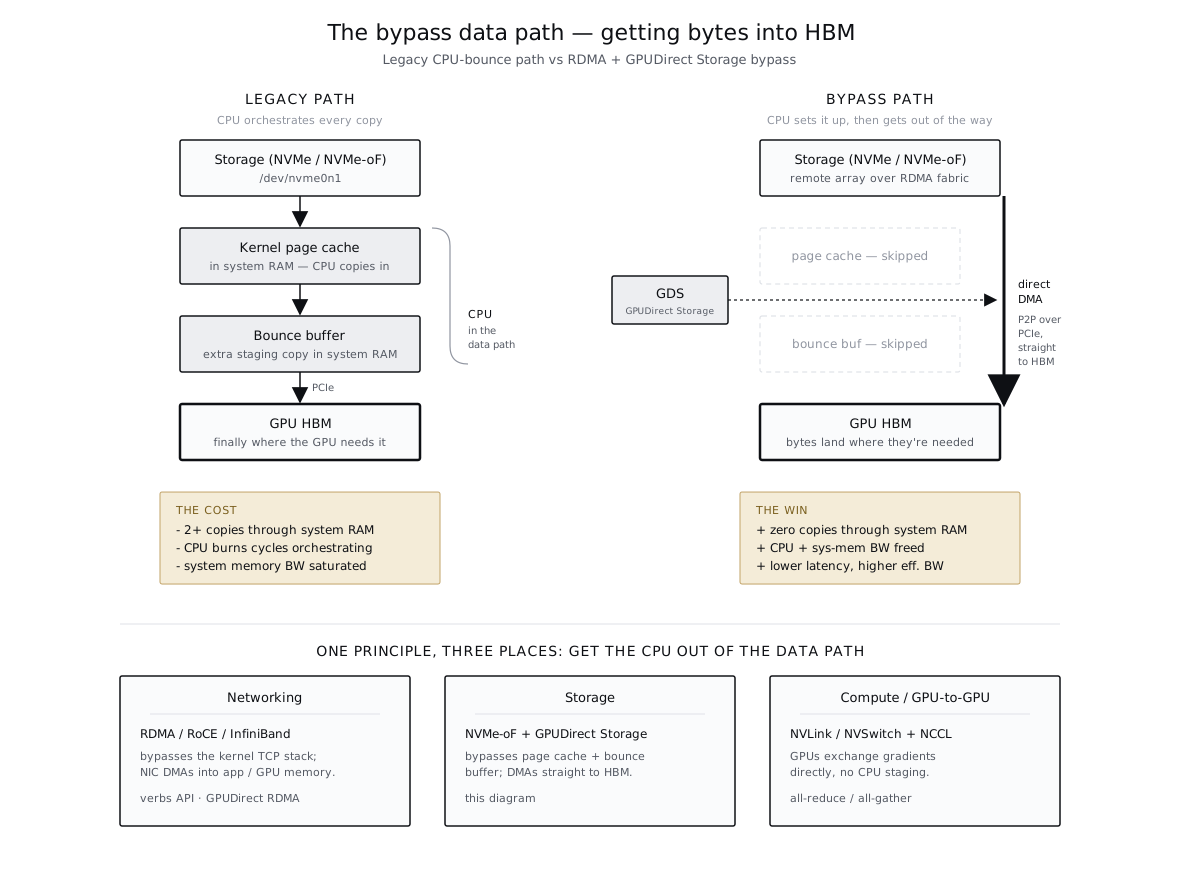
The legacy path bounces every byte through the CPU and host RAM on its way from storage to GPU. The CPU orchestrates every copy. Latency stacks. Memory pressure stacks. The CPU becomes a bottleneck even though it isn't doing work the user cares about.
The bypass path — RDMA + GPUDirect Storage — moves bytes directly from NIC to GPU memory without ever touching host RAM. The CPU sets up the transfer and gets out of the way. Throughput goes up, latency comes down, the CPU stops being the limiter.
Same architectural idea that's been quietly winning across the stack for a decade: get the CPU out of the data path wherever it's not adding value. NVMe SSDs over PCIe. RDMA NICs. GPUDirect. Each is the same pattern at a different layer.
For an AI cluster, GPUDirect Storage is the difference between training that's storage-bound and training that's compute-bound.
Under the hood — the Linux systems layer
The least glamorous diagram, and the one where the most real-world clusters break.
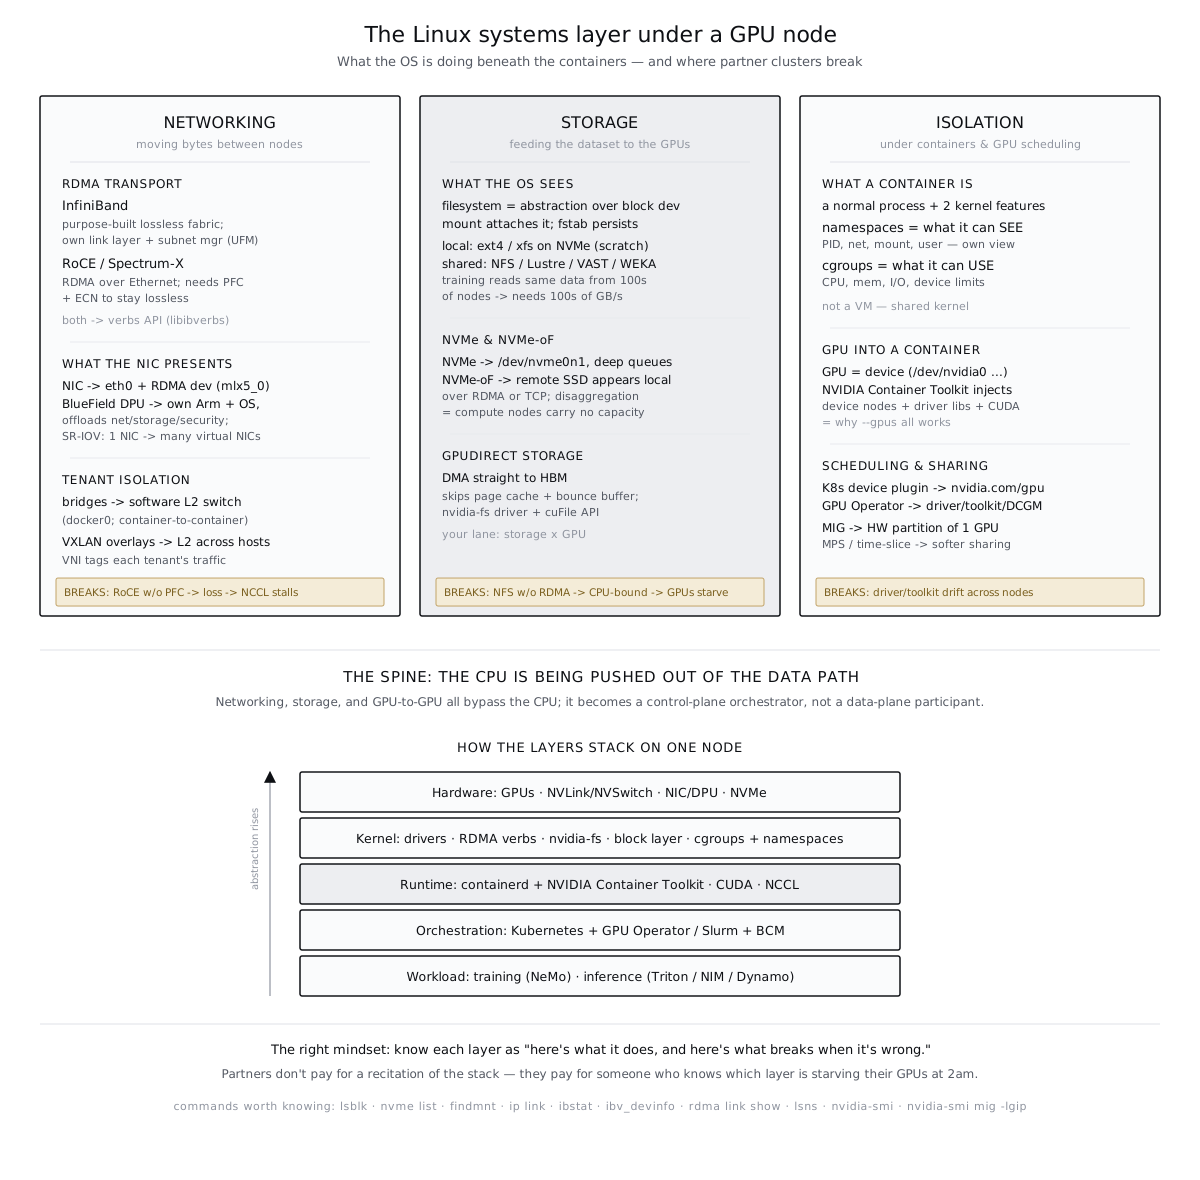
Beneath the containers and orchestration is a Linux node doing a lot of work the platform abstractions try to hide. RDMA transport (InfiniBand or RoCE). NUMA topology and CPU affinity. Hugepages for HBM-backed memory mapping. Driver versions that have to match across the cluster. Persistent device naming for repeatable startup. Network tuning beyond what enterprise sysadmin handles.
NVIDIA's Base Command Manager — and the broader DGX-stack tooling — exists in large part to manage this layer. The reason partner clusters often fail at scale isn't the GPUs; it's that the Linux substrate underneath wasn't tuned for the workload above.
For an SA, this is the conversation where customer engineering teams either trust you or quietly write you off. Knowing the OS layer well enough to ask the right diagnostic questions matters.
Closing the loop
When I meet a customer and they want to train a 1T-parameter model in 30 days.
Here is the full conversation we have which runs through every layer above:
- Model arithmetic. 1T parameters in FP8 with optimizer state ≈ 4 TB. Per-GPU memory budget after activation checkpointing tells us minimum GPU count. 30-day target tells us how many.
- Parallelism strategy. TP degree bounded by NVLink domain. PP depth chosen to balance bubbles against cross-node communication. DP width set to absorb the rest.
- Cluster topology. SuperPOD config picks itself once parallelism is set. Network fabric and storage tier follow from GPU count and training-time target.
- Power and cooling. GPU count × ~700W TDP × overhead factor → power envelope. Power × cooling efficiency → rack density. Rack density → facility square footage.
Every layer informs the next. A change at any layer ripples through.
What's next for me
More layers, more depth. Specifically:
- Orchestration and scheduling — Deeper on Slurm, multi-tenancy patterns at NCP scale.
- Observability — DCGM, profiling at scale, NCCL diagnostics, what "healthy" looks like at thousands of GPUs.
- MIG and inference serving — Triton, vLLM, Dynamo at NCP scale.
- The NVIDIA software stack — NeMo Framework, NeMo Retriever, CUDA-X libraries beyond cuDNN and cuBLAS.
I'll keep adding diagrams as I work through each layer. The story I want to tell — and increasingly can tell — is the full chain from model architecture down to CDU sizing, and back up.
That's the conversation worth having.
Building something infrastructure-heavy? Let's talk.
I'm an AI infrastructure advisor and senior solution architect based in Denver. Open to senior roles where deep technical depth meets enterprise sales credibility.